The Drag-And-Drop Report Editor: A new feature added to Google AdWords
Last week, Google rolled out its new feature, the Drag-And-Drop Report Editor for AdWords that will be incorporated over the next few months into all AdWords accounts.
This new feature is welcomed by all those promoters who like to have pivot tables in Excel, instead of repeatedly extracting data even to make a small tweak in a report.
But for those who are less familiar about Excel and its features, the pivot tables can prove to be a powerful method of organizing the rows of the data. Once this Drag-And-Drop Reporter Editor is added to your account, Google will guide you through the procedure of creating your first report, the first time you click on the Reports tab.
The three great features of this reporting update as shared by Jason Tabeling, partners at Rosetta, are as follows:
1. The Ability to Change Data Inputs Quickly
Once you pull a report into the Excel and you realize that the data doesn’t match the answer to your question, you go back and pull a different set. But each time you pull down a report, you need to recreate the pivot table, but with this feature you can alter data inputs, date ranges, and so on easily and very quickly.
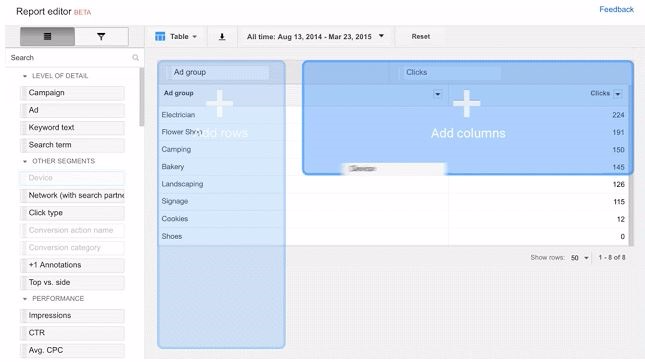
2. Filter Functionality
Quite often when you need to view the report layer by layer, through filter feature you can pull specific keywords or ad group level details and then dive in.
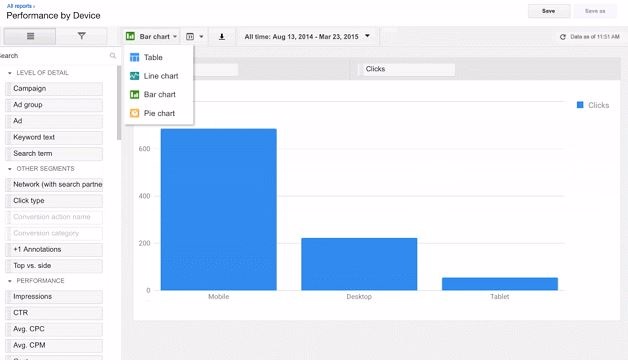
3. Graphs
Data has no value until it is not sketched into a pretty graph. But Drag-And-Drop Report Editor feature does a nice job by representing data on basic charts as well as graphs. It allows you to visualize the data easily and quickly, besides allowing you to pull data into the presentation that includes schedules and email reports.
Three things to be expected from Google in its future releases:
1. The Ability to Create Formulas
Having the ability of creating custom metrics can be valuable for the individuals. Just like, to evaluate true ad effectiveness, one can measure the CTR conversion rate.
2. Report Editor Functionality Across Accounts in the My Client Center (MCC)
To meet varying demands of the clients, individuals need to create a benchmark report. But for preparing the report one needs to pull the data from multiple clients. This process can be facilitated by using some of the features from the Report Editor in the MCC.
3. Groupings
Great way to quickly pull altogether different dates and branded terms versus non-branded terms. If individual only wants to see quarters, then they can expand the data into different sets of quarters and can see the monthly views.